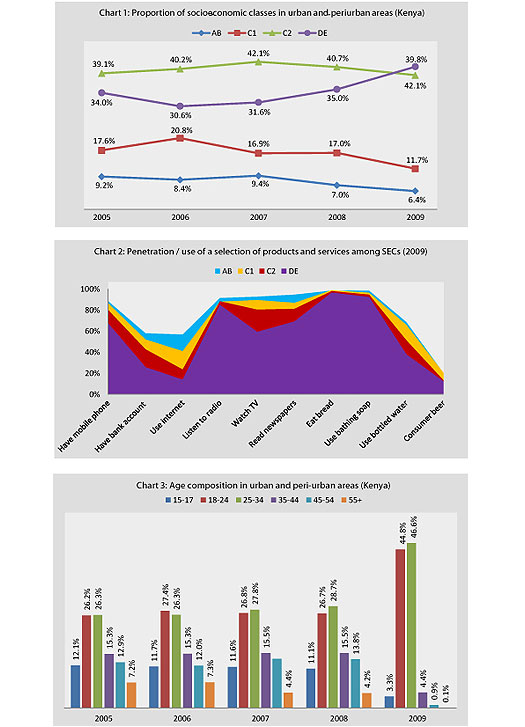

The socio-economic classification of populations allows one to approximate the proportion of society who live in upper, middle, and lower income households. The AB, C1, C2, and DE taxonomy has been used for decades and is the more widely understood method in this market notwithstanding the recent migration to Living Standard Measures (LSMs). The AB socio-economic class (SEC) represents upper income households, C1C2 middle income, and DE lower income.
For many years, C2s (the lower end of middle income households) made up the largest proportion in urban and peri-urban areas of Kenya and many mass-market products, services, and brands were targeted to this demographic, not least because they were many in absolute numbers and were not considered destitute or cashless. But as the first chart below illustrates, the proportion of DE households has been rising over the last 4 years – C2 and DE homes now constitute 80% of households up from 73% in 2005; the proportion of C1s (the upper end of middle income households) and ABs has gone down, comprising just 18% of households down from 27% in 2005. This suggests that there are more urbanites slipping towards impoverishment; it also implies that the proportion of households with a decent amount of disposable income is shrinking.
This does not mean that bottom-of-the-pyramid households are not consumers – as the second chart shows, penetration and use of mobile phones, radio, TV, newspapers, bread, and bathing soap are high among all households including lower SECs. These consumption patterns are no doubt driven by an increasingly younger population – the 18 to 34 years olds have surged from 53% of the urban and peri-urban population in 2005 to 82% in 2009 while the over 45s are fast disappearing from the urban landscape (third chart).

TGI is conducted in the urban and periurban areas of Nairobi, Mombasa, Kisumu, Nakuru, Eldoret, Nyeri, Machakos, Thika, Meru, Voi, Kakamega, Mumias and Kisii among females and males aged 15 years and above. With an annual sample of 10,000 +, TGI covers the following sectors:
contact Dr. Havi Murungi
hmurungi@ciafrica.com
| Communication & Media | FMCG & Manufacturing |
Finance | Lifestyle |
| Radio | Food | Banking | Household products |
| Television | Toiletries & cosmetics | Insurance | Sports & leisure |
| Sweet & snacks | Mortgages | Motoring | |
| Telephones | Pharmaceuticals | House ownership | Holidays & travel |
| Internet | Non-alcoholic drinks | Credit | Electronics & personal items |
| Cinema | Alcoholic drinks | Investment | Appliances & household durables |
| Outdoor | Tobacco | Plastic cards | Shopping, retail & clothing |


